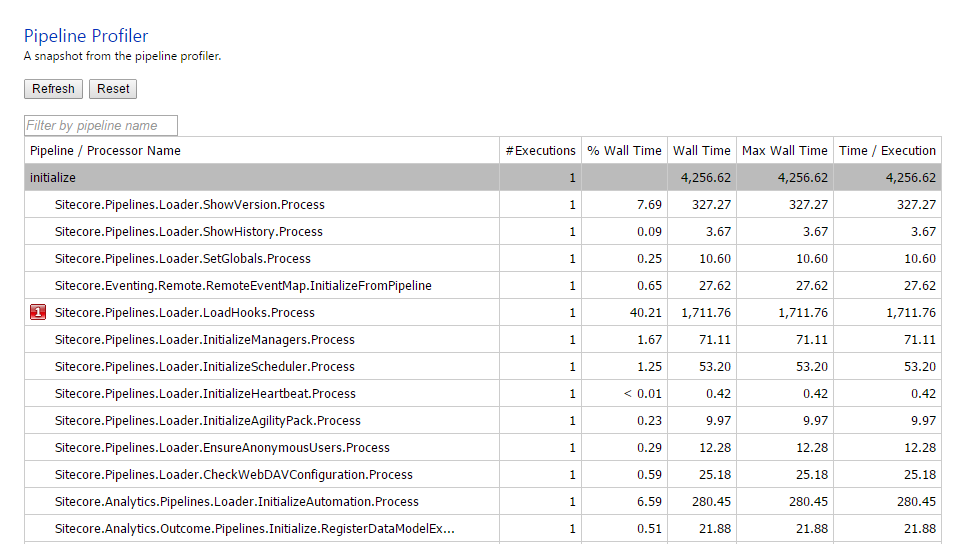
In Sitecore version 7, Sitecore introduced a new profiling tool, the Pipeline Profiler. From the Pipeline Profiler tool, you will be able to monitor performance and utilizations of all the Sitecore pipelines used by the Sitecore solution (the Sitecore client and the website). The Pipeline Profiler tool listing the profiling data for each of the pipeline processors.
Getting this data, you will be able to pinpoint the processors spending most of the time and improve performance by optimizing those specific processors.
You access the Pipeline Profiler tool from yourDomain/sitecore/admin/pipelines.aspx (the same location as the stats.aspx, showconfig.aspx, dbbrowser.aspx etc). However, Sitecore disables the Pipeline Profiler tool by default:
To enable the tool, the only thing you need to do, is to enable the Sitecore.PipelineProfiling.config.disable (by removing the “.disable”) located at /App_Config/Include, and reload the Pipeline Profiler tool:
In Sitecore 8, the Sitecore.PipelineProfiling.config file contains only two settings, the “Pipelines.Profiling.Enable” and the “Pipelines.Profiling.MEasureCpuTime” respectively:
        <configuration xmlns:patch="http://www.sitecore.net/xmlconfig/" xmlns:set="http://www.sitecore.net/xmlconfig/set/">
            <sitecore>
                    <settings>
                    <!--  PIPELINE PROFILING ENABLED
                             Specifies whether or not pipeline profiling is enabled. When it is enabled, a profiling snapshot is available
                             at /sitecore/admin/pipelines.aspx.
                             Default value: true
                    -->
                    <setting name="Pipelines.Profiling.Enabled" set:value="true" />

                    <!--  PIPELINE PROFILING MEASURE CPU TIME
                            Specifies whether or not the pipeline profiler measures CPU usage. Measuring CPU usage adds a performance overhead
                            to the pipeline but provides additional information about the behavior of the processors.
                            Default value: false
                    -->
                    <setting name="Pipelines.Profiling.MeasureCpuTime" set:value="false" />
                </settings>
Notice, the value of “Pipelines.Profiling.MeasureCpuTime” is false by default. Setting it to true, the Pipeline Profiling tool will measure the CPU usage as well:

If we add a new custom processor to the httpRequestPipeline etc. the new processor will be measured as well (In this case, the only thing the processor does, is sleep in 5 sec.)

Notice that Sitecore highlights the three processor of each pipeline taking most of the resource (indicated by the image number to the left of the processors).
The performance and utilization details declaration are at the bottom of the Pipeline Profiler tool:

No comments:
Post a Comment